Getting started with Firefox OS
Book of FoxChapter4 ▼
Debugging
Logging
As a web developer, you're probably accustomed to having access to the console object and its family of methods, such as console.log('omg!');. The good news is that you can use the same logging mechanism in your mobile apps too. Let's see how. While trying this out, you can also practice changing code and running the app to see the difference.
Update your update() function with a call to console.log() so it looks like:
function update() {
  console.log('battery level', batt.level);
  var text = 'Your battery level is ' + Math.round(batt.level * 100) + '%';
  document.getElementById('batt').textContent = text;
}
Go to the R2D2B2G extension tab in your desktop Firefox and click the "Update" button found in your "Battery" app row in the dashboard.
This is the closest to a good old page refresh you're used to from web development. Your app is updated and relaunched in the simulator. Now find and bring up the console window, so you can see a message that says something like "battery level 0.78".
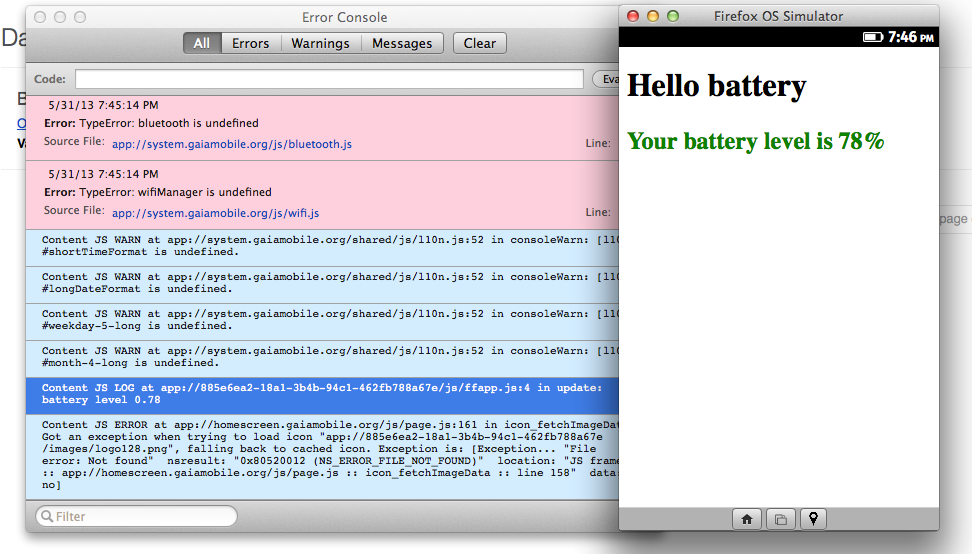
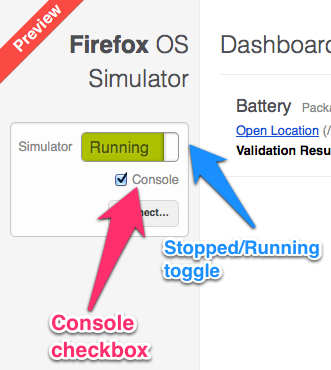
If you don't see the console window, chances are you didn't start the simulator with the console enabled. To fix this, close the Simulator window first (alternatively you can stop the simulator by clicking the "Running" toggle in the R2D2B2G extension). Then make sure the "Console" checkbox on the left-hand side is checked. Now start the simulator again either by clicking "Stopped" toggle, or "Update" or "Run" buttons in your app.
Device logging
How about using console.log() when testing on the device. Good news, it's possible. Once you've setup your copy of adb you can see the logs from the device using:
$ adb logcat
This will show you an overwhelming list of a lot of things happening on the device. But you can grep and filter only down to specific messages that interest you. Setting up an alias makes your life easier, like so:
alias lolcat='adb logcat | grep "JavaScript Error\|Content JS"'
This command will show you the output of your console.log() calls as well as any JavaScript errors.
Debugging
Logging in the console is helpful to dump some intermediate information and see what's going on in your application, but quickly reaches its limitations as a debugging tool. Luckily you can do proper debugging while developing your app.
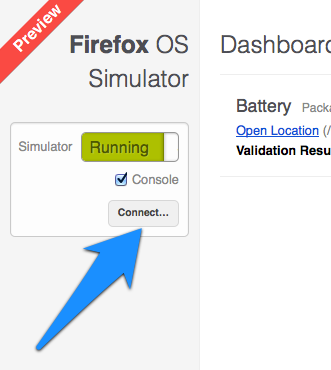
When you run the simulator, you can notice an additional Connect⦠button that appears under the Stopped/Running toggle.
Following the button you get another screen that allows you to connect to a remote device.
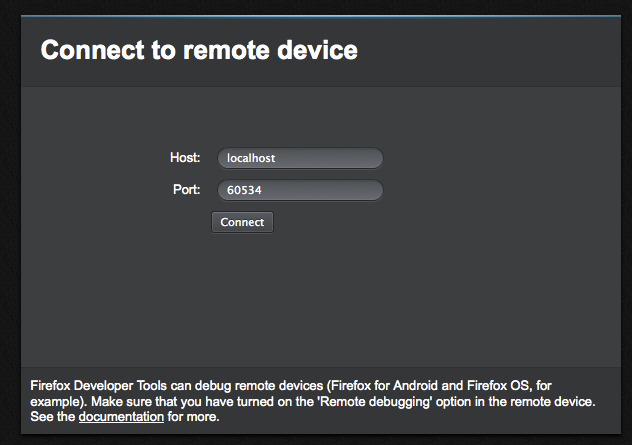
This means you can connect to a phone and debug the code running on the device. But the same feature allows you to connect to the simulator. The host and port for the connection are conveniently pre-filled you you.
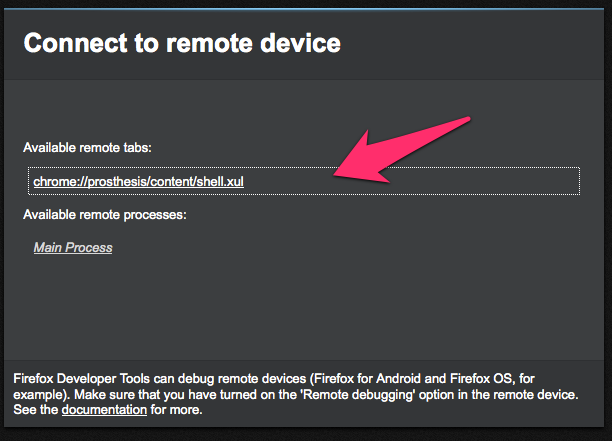
On the next screen, you click the first link under "Available remote tabs" heading.
Lo and behold - more developer tools including a console, a profiler and a debugger. Try the "Debugger" tab. You get a list of all the script evaluated on the device. This means you can also look into and debug the system code that's powering the phone. There's nothing scary in the term "system code", it's all JavaScript anyway and the whole UI of the phone is nothing but a web page.
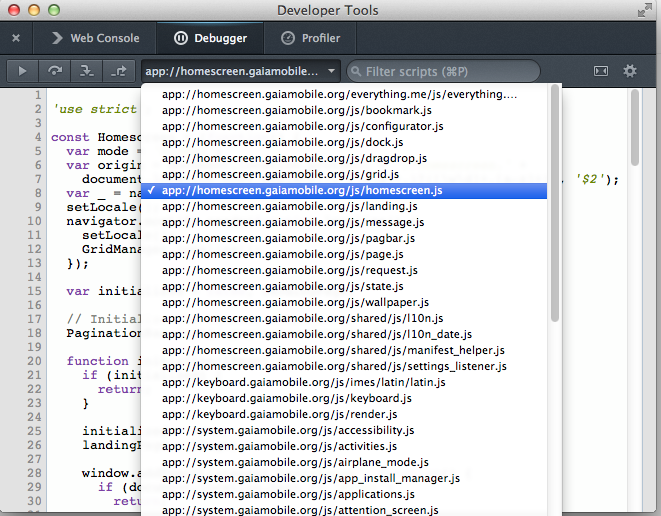
In the debugger you can put breakpoints, step through the code and so on. Let's give it a try.
Debugging the battery app
Let's invoke the debugger from within the update() function of the app.
Replace the console.log(); call with a debugger; statement, like so:
function update() {
  debugger;
  var text = 'Your battery level is ' + Math.round(batt.level * 100) + '%';
  document.getElementById('batt').textContent = text;
}
Next, click the "Update" button next to the app to get the latest code. Then, close the debugger window and restart it by connecting again and clicking the Debugger tab.
|
Note
|
You don't have to close and reopen the simulator, but you need to close and reopen the debugger to see your latest changes. |
Now that you have both the simulator and the debugger open, your code should pause execution whenever it enters the update() function. Since you don't want to wait for the battery level change event, you can click "Update" again to "refresh" the app.
You should see something like this:
((image_debugger; paused]]
Click the "Step In (F8)" twice so the execution moves past the var text = ... line. You can see the value of the text variable on the right hand side getting updated to something like "Your battery level is 72%".
((image_Your battery level is 72%]]
Feel free to experiment, for example click the value of the text variable and change it to "potatoes". Then click the blue "play" button to continue code execution.
((image_hello battery potatoes]]